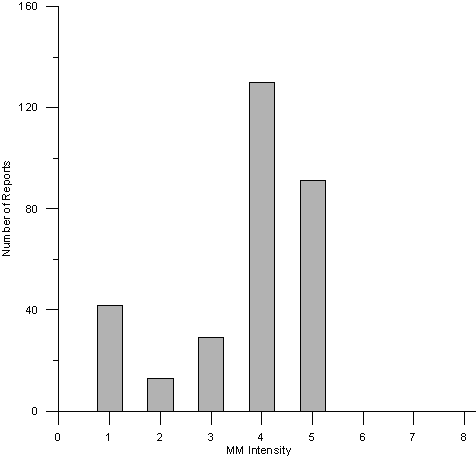
Bar-chart of the number of reports per intensity value

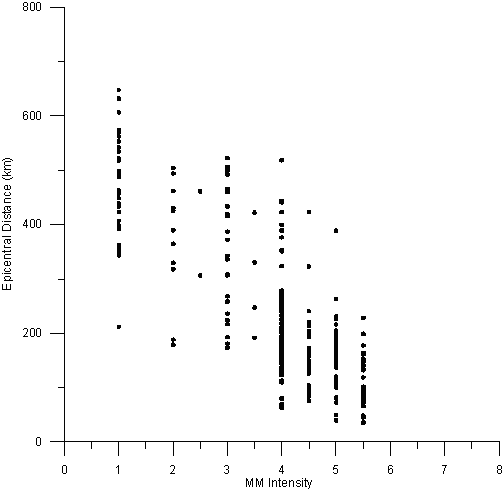
Plot of the intensities versus distance from the epicenter
|
|
|
Bar-chart of the number of reports per intensity value |
|
|
|
Plot of the intensities versus distance from the epicenter |